

Yesterday, we outlined the different categories the Storm Prediction Center (SPC) uses when describing the severe weather threat in an area on any given day. Today, we’ll learn more about the key factors that the SPC uses to determine what threat level to assign.
To be clear, there are plenty of individual fancy-pants environmental indicators that feed into the risk for severe weather… CAPE, Helicity, Significant Tornado Parameter, Supercell Composites, and plenty of others… but when you factor in all of them you get a few big areas that help determine the actual categorical risk: tornadoes, damaging wind, and hail.
That’s why, along with the categorical outlook, SPC issues a series of maps that outlines multiple forms of risks for each of those three factors. Paying attention to these maps will help you get a better idea of what the most pressing threat is for your area and help you better prepare for what’s to come. So let’s look at some examples of this using the same severe weather system we looked at in Part One, the evening of January 22, 2017.

Tornado Risk is a “probabilistic” map that shows the percentage chance of a tornado occurring within 25 miles of a particular point on the map. The percentage chances are broken down into 2%, 5%, 10%, 15%, 30%, 45%, and 60%. In this example, there’s a 15% chance of a tornado occurring within 25 miles of Disney, Sea World, Universal, or Legoland. There’s a 30% chance of a tornado within 25 miles of Busch Gardens.

Significant Tornado Risk shows the percentage chance of a “significant” tornado… that is, an EF2 or worse with winds of 111 MPH or higher… occurring within 25 miles of a particular point. In this case, the map shades any area with at least a 10% chance of this occurring. The SPC typically shows this on the regular tornado map as a black hatched/dashed area on top of the regular colors. We prefer to instead put this on a separate map as it can be a bit confusing when combined with the normal tornado data. In this example map, there’s at least a 10% chance of an EF2 tornado (winds 111 MPH or higher) occurring within 25 miles of any point you pick within the shaded area, such as SeaWorld or Kennedy Space Center.

Wind maps show the risk of damaging winds occurring within 25 miles of a particular point. The risk levels are a bit less discrete than the tornado maps, grouped into 5%, 15%, 30%, 45%, and 60%. For these purposes, “damaging” winds are considered to be 50 knots, which converts to about 58 MPH. 58 MPH winds are a trigger point to issue a severe thunderstorm warning, so the criteria here is no coincidence. In our example, the Orlando-area parks as well as Kennedy Space Center are at highest risk, with a 45% chance of damaging winds within 25 miles. Busch Gardens and Legoland are at a slightly lower risk (30%).

Significant Wind maps show the risk of 65-knot winds within 25 miles of a particular point. 65 knots converts to about 75 MPH… or in other words, hurricane-force winds or stronger. Like the Significant Tornado map, it’s distilled down to showing only 10% or higher chances. And like the significant tornado risk, SPC usually shows these as a black hatched overlay on the regular wind map, but we keep it separate for simplicity’s sake. In this example, pretty much the entire attractions area is covered.

Hail maps show the risk of hail at least 1″ in size occurring within 25 miles of a particular point. Much like the criteria on the Wind map, 1″ hail is one of the trigger points for a Severe Thunderstorm warning. The risk levels are the same as shown on the wind maps… 5%, 15%, 30%, 45%, and 60%. In this example, there’s a 15% chance of 1″+ hail at most of the attractions, but a 30% chance at or near Busch Gardens.

Significant Hail maps show the risk of hail at least 2″ in size occurring within 25 miles of a particular point. Much like the Significant Tornado and Significant Winds maps, this shows only a single level of probability…10% or higher. Again, these significant risks are usually shown as a hatched overlay on the hail map, but we keep it separate to lower confusion. In this example, none of the attractions have to worry about hail larger than 2″ in size. In the words of Forrest Gump, “That’s good. One less thing.”
So let’s compile everything we’ve learned about this particular day in 2017. And let’s focus on Disney as our point of interest. The maps show us that Disney has:
- A 15%+ chance of a tornado occurring within 25 MPH
- A 10%+ chance of an EF2+ tornado occurring within 25 MPH
- A 45%+ chance of damaging winds occurring within 25 MPH
- A 10%+ chance of 75 MPH+ winds occurring within 25 MPH
- A 15%+ chance of 1″+ hail occurring within 25 MPH
- Less than a 10% chance of 2″ hail occurring within 25 MPH
That gives us a good idea that the most likely threat is damaging winds but tornadoes and hail are still a notable possibility. How to best communicate that? That’s where the categories that the SPC uses come in. In part one, we discussed risk levels of Marginal (1 of 5), Slight (2 of 5), Enhanced (3 of 5), Moderate (4 of 5), and High (5 of 5). And those risk levels are assigned based on the probabilistic risks in each of the individual hazards shown above. Each percentage level of each hazard is assigned one of the five categories of risk, and a chart is referenced to determine which overall risk category to assign for the day.
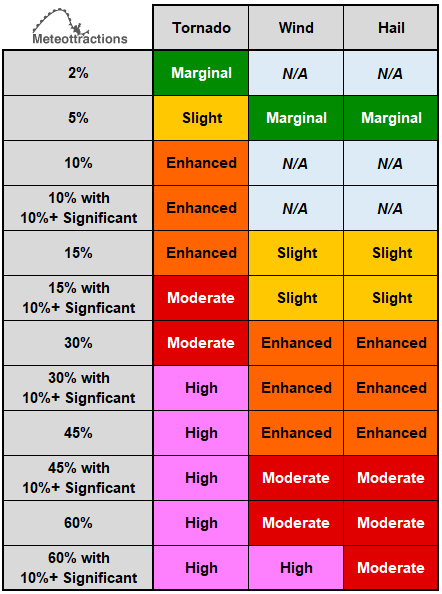
In our example, we saw that Disney had a 15% chance of a tornado, with at least a 10% chance of a significant tornado. That equals a Moderate Risk (level 4 of 5) based on the chart above. The wind risk of 45% + 10% significant equals an Enhanced Risk (level 3 of 5), and the hail risk of 15% with no significant hail risk would equal a Slight Risk (level 1 of 5). The highest of these three resulting categories “wins,” so it looks like Disney should be at a Moderate Risk (level 4 of 5) for the day. Let’s check our work! Here’s the categorical map issued by the SPC that day:

Well would ya look at that? A Moderate Risk (level 4 of 5) for Disney. Just for kicks, go back and look at all the maps for Busch Gardens and see if the formula works for there, too.
Whew! That was a lot of work! And to think, the SPC does this five times a day! The convective outlooks are issued at the same time every day… 06:00Z… and updated again at 13:00Z, 16:30Z, 20:00Z and 01:00Z. The Z stands for Zulu time, also known as Coordinated Universal Time. (You’ll also see that abbreviated as UTC, because in English it’s Coordinated Universal Time, and in French it’s Temps Universel Coordonne, and apparently they wanted to make sure that the abbreviation didn’t make sense to anybody). UTC/Zulu time is preferred by weather folk because it’s immune to shenanigans such as time zones and Daylight Saving Time, which can be useful if you’re issuing an outlook that covers several states. Of course, as a result, we have to convert it so it makes sense to us, which puts us right back into the realm of time zones and time changes. If the most recent clock change you made was to Spring Forward, UTC/Z is four hours ahead of Eastern Daylight Time (so the 06:00Z outlook comes out at 2:00 AM EDT). If the most recent clock change was to Fall Back, UTC/Z is five hours ahead of Eastern Standard Time (so the 06:00Z outlook comes out at 1:00AM EST). That’s why most weather offices around the country have a giant UTC clock next to the one showing the local time.
So there you have it… a two-part guide to hopefully better explain the hows and whys behind the Categorical Outlooks. Learning how to use them will help you be a bit more weather-ready the next time we’re at risk.
Pingback: Understanding Severe Weather Outlooks: Part One – Meteottractions
Pingback: Marginal Risk of Severe Weather Wednesday 07/03 for Attractions Area – Meteottractions